.png)


THE CLIENT
Ozarke launched in late 2019 and scaled to mid-seven figures selling lighting, wall panels, and furniture. By 2023, the business was well-established - but Alex knew that with the volume of paid traffic they were driving, there was significant revenue being left on the table.
THE CHALLENGE
Ozarke operate in a competitive market, with heavy pressure from dropshippers undercutting on price. Margins matter. Relying on discounts and exit-intent offers to prop up conversion was eroding profitability without solving the underlying problem.
They had good traffic. The opportunity was making more of it.
They'd previously worked with a CRO agency but found it required too much internal management - time they didn't have with a lean in-house team. Having followed CWC's content on LinkedIn, Alex reached out.
The goal: run a serious CRO programme that could support their ambition to significantly scale paid media spend over the next 12 months.
WHAT WE FOUND
Every engagement starts with research - customer interviews, review mining, support ticket analysis, and behavioural analytics. For Ozarke, that research pointed clearly to the product detail page as the main drop-off point.
Three focus areas emerged:
- Usability - customers were struggling to find products. Heavy PLP scrolling, lots of back-and-forth. But search - when used - converted well. It just wasn't visible enough.
- Anxiety - customers had unanswered technical questions. Dimensions, voltage, lumens, installation. These weren't being addressed on the PDP before the add-to-cart decision.
- Motivation - customers wanted to see more of the product. The image gallery was the most-engaged element on the page, suggesting purchase confidence was tied directly to visual depth.
One additional insight that shaped our testing: Ozarke's customers valued the fact it was a US brand with its own product line - not a dropshipper. That trust signal wasn't being communicated clearly enough.
WHAT WE TESTED
Over 9 months we ran multiple experiments, achieving a 71% win rate. Industry average is 10-20%. Two tests that drove significant impact:
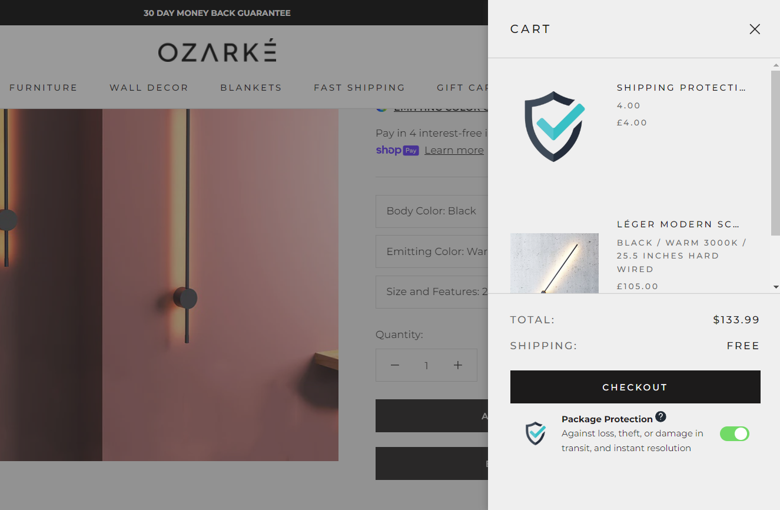
Test 1 - Cart cost breakdown
The slide cart showed a single total with no mention of shipping. The CTA read "Checkout - $X", directly linking the price to the act of proceeding. This created unnecessary friction.
The winning variant separated the cost breakdown, confirmed free shipping explicitly, and reframed the CTA as a simple next step rather than a payment commitment.
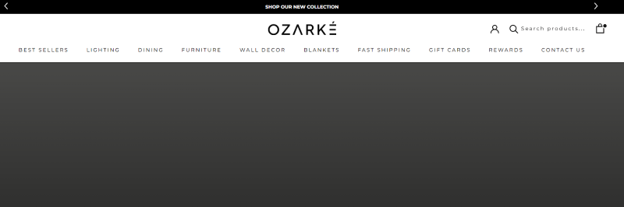
Test 2 - Search bar visibility
Search was converting well - but barely anyone was finding it. The control showed a small icon between account and cart.
The winning variant partially expanded the bar with the text "Search Products." A fully-expanded version was also tested but underperformed - too disruptive to the header layout.
THE RESULTS
Across the programme, our tests generated over $150,000 in additional monthly revenue for Ozarke - a 6.9% increase in conversion rate and 37.8% increase in revenue per user.
With CRO providing a predictable baseline lift, Ozarke were able to scale their paid media spend with confidence - knowing the traffic they drove would convert at a higher rate.
WHAT ALEX SAID
"Will and his team are very professional. They come in day one, they know exactly what needs to be done. They deliver results, they do what they say they will do. Customers Who Click is one of the most professional companies you can work with - and they achieve results very, very fast."
"The tools they use to help ecommerce founders engage in the process are very simple and straightforward. They hold your hand from A to Z."
— Alex Elsaadi, Founder & CEO, Ozarke
Find out where you're losing revenue and what CRO can unlock for your next stage of growth - Schedule a CRO Discovery Call with us today
Great brands tackle them with CRO.
can unlock your next stage of growth.