.png)


The Problem
MOD Lighting came to us having established the brand over the previous 12 months and were looking to scale the business aggressively. Their key goal was to consistently record 7-figure months.
However...
- ROAS was not great and it was proving difficult to scale paid spend.
- They were overly reliant on paid acquisition and needed other methods to grow the business without having to increase that ad spend too much.
- They already had a lot of traffic, they just needed to capitalise on that traffic more by converting it better.
- They didn’t have the resources or expertise in-house to run a CRO program.
- They didn’t know where to start with CRO and how to identify opportunities that would really move the needle.
What Had They Done To Try To Resolve The Issue?
- Boosting conversion generally relied on sales and discounting. The audience appeared to be quite price-sensitive and running sales on-site was generally proven to increase sales.
- However, these sales often came in at around 25% reduction in revenue.
- A few changes had been made to the website over the previous few months, but no real CRO work or testing has been carried out. They had however installed a few apps for the purpose of improving conversion rates.
- A welcome offer popup was also launched on-site to capture email addresses and attempt to convert visitors in the long run.
How Customers Who Click Helped
Every project starts with research.
We speak to customers, we mine reviews, and we audit customer service logs.
Leveraging our bespoke GPTs, we're able to quickly and efficiently analyse huge amounts of data, giving us quick, accurate insight into the problems MOD was facing.
We had to know what MOD’s customers actually cared about when making a purchase.
These purchases have longer consideration periods, customers are committing to quite high spends for something that has quite a big impact in their lives. If they choose the wrong lighting, there’s some serious regret involved, which leads to a negative feeling towards a brand that we want to avoid.
Step 1 - Research
What Research Methods Did We Employ?
- Google analytics - everything starts with a review of Google analytics to find some low hanging fruit in terms of technical blockages, but also to assess where in the funnel most customers were dropping off.
In this case it was the Product Detail Page (PDP).
While these pages got plenty of traffic, the add to cart rate was very low.
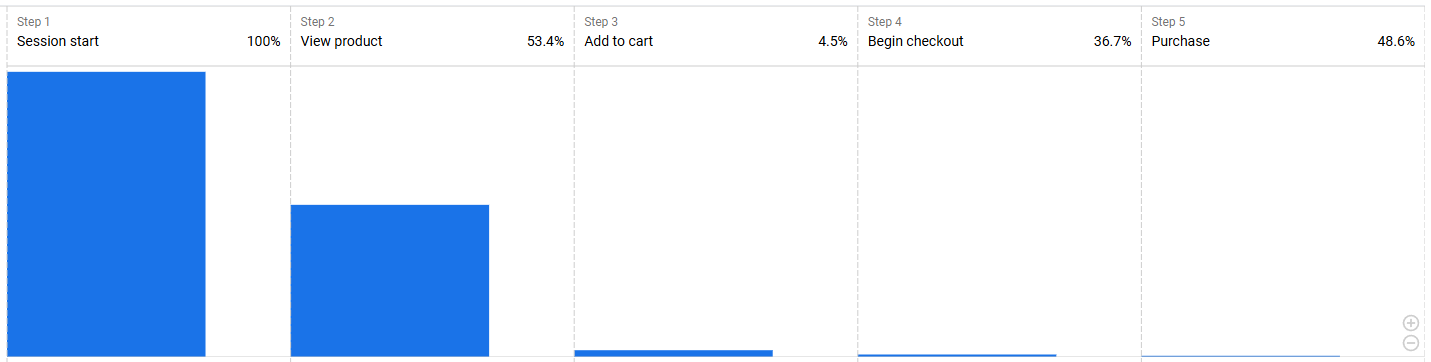
*Due to client confidentiality, this is is just a representative image.
- Behavioural Analytics - having identified PDPs as the main opportunity, we then used heatmaps and session recording to analyse those pages.
What were MODs visitors seeing on the page, where were they interacting, and what were they missing?
- Customer Feedback - finally, and most importantly, we spoke to their customers through a mix of email survey and face to face interviews.
Here we were looking for 2 key pieces of information.
1
- What was holding people back from making a purchase?
2
- What were their customers looking for in lighting? What was their desired outcome?
These are the two key areas we have to identify in order to improve conversion.
Why did some people buy?
Why did others not?
When we’re analysing the data and the feedback we aim to pick out several key focus areas for testing, based on 3 key customer behaviours.
Usability, Anxiety, And Motivation.
In the case of MOD lighting we found 3 key areas that would be the focus of our testing.
1. Usability: A lot of request for customisation of products led us to believe that the current swatch layout for product options was overwhelming. It presented too many options and was difficult to absorb the information provided.
2. Anxiety: Customers couldn’t find the information they needed regarding the products. Things like voltage, installation instructions, country certifications, and even what bulb was required if it needed replacing.
3. Motivation: Customers wanted to have the sexiest lights in their neighbourhood. They wanted something different, that their friends and neighbours would be impressed by.
Step 2 - Testing
Once we’ve identified our Focus Areas, or bottlenecks, we start to create tests to explore our hypotheses.
In some cases, it wasn't that information was missing, visitors just weren't seeing it where it currently was. So it's not simply the case of adding information, it was about how do we get this key information in front of customers, without disrupting their flow on the page.
For each focus area we come up with 5-10 experiments, each of which has 3 ideas attached to it in order to allow us to speed up the iteration process immediately.
It can be quite easy to think of an idea for a test, but when forced to come up with 3 options for fixing the problem, we really explore the issue more deeply and come up with better initial solutions.
In addition when it comes to the iteration phase we already have a much deeper understanding of the problem and our route to solution.
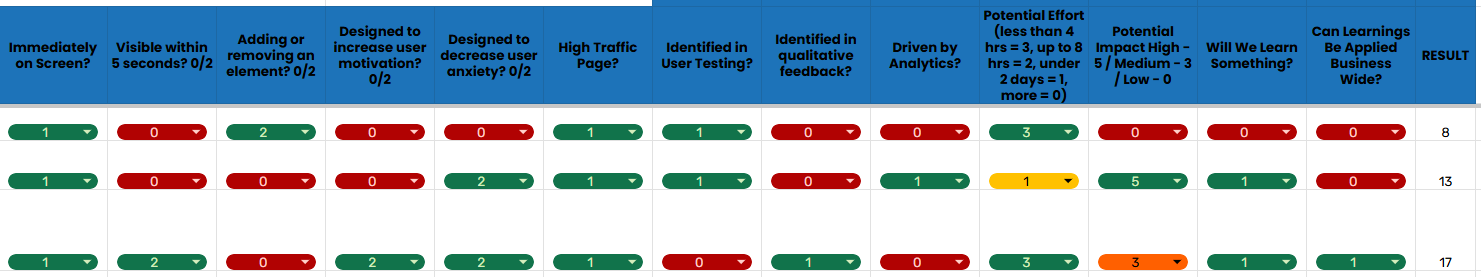
We then prioritize which tests to run based on an 8-point scoring model to determine the impact of the test vs the effort required to build it.
We then follow a set process when rolling out tests:
1. Our designer creates the solution for our test in Figma.
2. The development team builds the test, normally in an A/B testing tool, sometimes on-site depending on the complexity of the test.
3. We QA the test across different browsers, devices, and screen sizes to ensure it works as expected.
4. The tests are passed to MOD Lighting for final approval before going live.
5. Tests are run to a minimum of 90% statistical significance and 80% power.
The main metric we're basing results on? Revenue Per User.
While our aim might be to improve conversion rate, if a test has a negative impact on AOV which negates any conversion increase, we may not want to implement that test live on site.
But we don’t just finish there.
Before we actually resolve a test and move on we assess 3 more things:
Learnings - how did the test perform against our hypothesis?
Recommendations - to implement or not, and whether this should only impact certain segments, channels, or devices
Iterations - regardless of whether a test is successful or not, we don’t just leave things there. There was a reason we tested something, so there’s valid reason to keep testing it.
Step 3 - Iteration
Iterative improvements is the key to CRO and A/B testing.
- If a test is successful and increases our chosen metric, then its likely we can do even better with a further test.
- Likewise if a test is unsuccessful, we need to review, understand why, and test something new. There was a reason we identified this area for testing, so it may just be that the execution was wrong.
Finally, once we have established why our tests won and the impact they had, this insight can be passed on to the wider business for further exploitation.
The learnings we gain from CRO can be hugely beneficial to the acquisition & retention teams, as well as product development, customer service and much more.
How Did We Work With MOD?
At Customers Who Click we believe in transparency and collaboration.
- With MOD Lighting we had 1 call every week for the first month.
- We then move to a call every 2 weeks once testing beings to discuss the pipeline, any new ideas, and any updates from MOD (E.g. changes to the team, new tech platforms they are introducing, or new commercials and business models they want to explore.)
Not only can we provide insight and advice into these areas, but they may impact testing so its important we’re aware.
We share our project management tool with MOD Lighting, allowing for a view on which tests are where in the pipeline, and also it allows us to tie communicate efficiently regarding each individual test, and allows us to gain an understanding of which types of tests work well, which dont, and which research is contributing to success and growth for MOD.
Finally, we connected with MOD via Slack for day to day comms and any emergencies while email is for anything we don’t want to get lost.
What Results Did We See?
Over the course of 5 months we ran 24 tests for MOD Lighting, with an impressive 50% win rate (most testing programs achieve 10-20%).
We achieved this high success rate due to the intense research and planning that goes into our testing.
Everything we test is done for a reason, and that reason comes from data and customer feedback.
Additionally, every test must have 3 solutions outlined for it to ensure that everything has been carefully thought through.
Overall, our tests generated 6-figures in additional monthly revenue for MOD Lighting.
Example Test - Product Dropdowns
One of our most successful tests for MOD Lighting involved cleaning up the product page options, and giving them the feel of a step by step process before adding to cart, rather than the existing experience which crowded the page with options.
As you can see in the image below of the winning variant, we introduced dropdowns for each product variant.
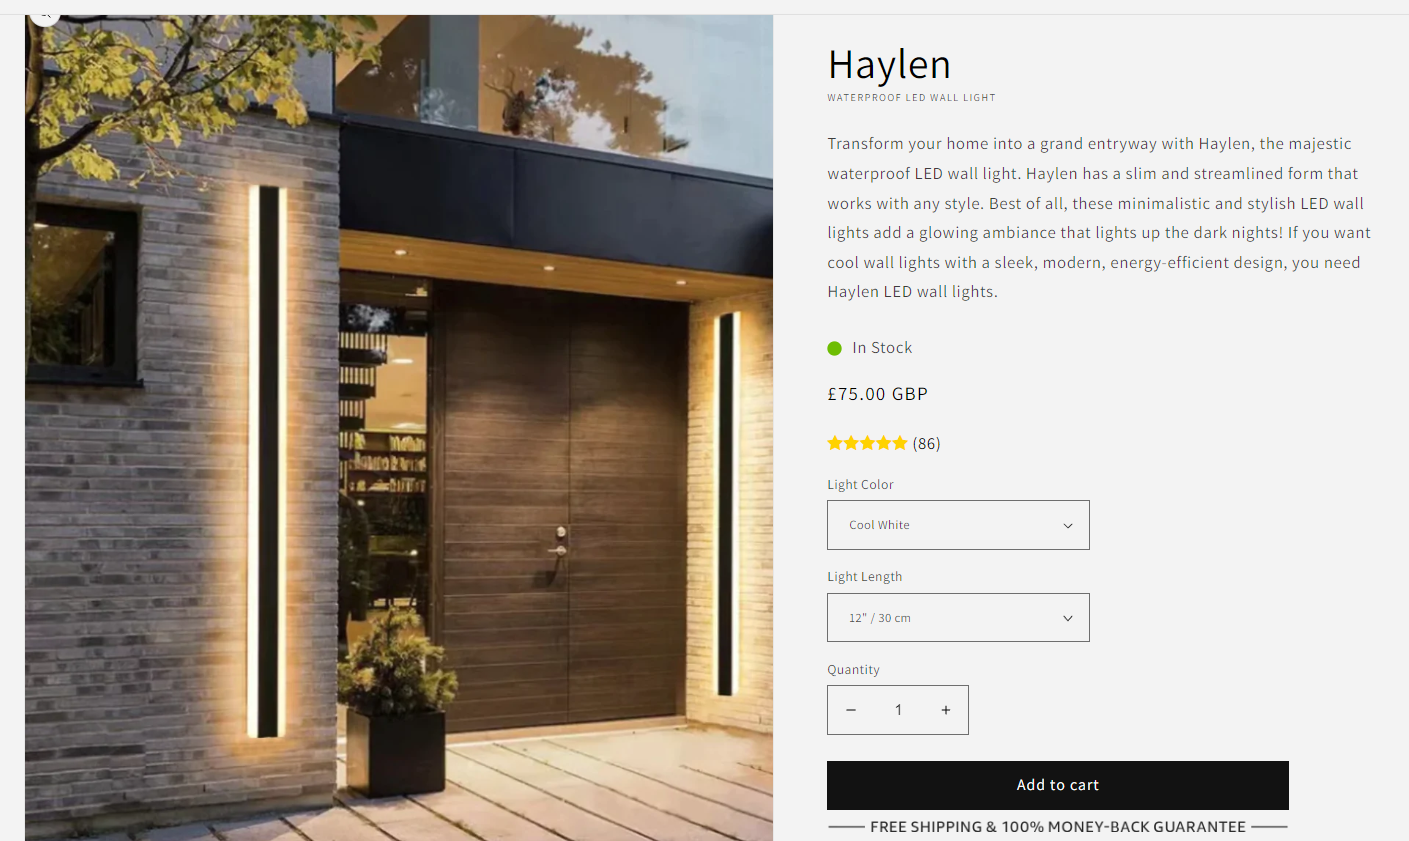
This had 2 key impacts on the page.
Firstly, this particular product (their best seller) had a total of 14 options on the page, all displayed as individual swatch buttons. So by introducing dropdowns we were able to significantly reduce the space required for these options, and reduce crowding on the page.
Secondly, this new design created a much more focused step by step process for the product. Customers now clearly had to pick their light colour, pick their light length, quantity and then add to cart.
This test alone improved had a significant impact on conversion rate and AOV, and the paid media ads that were targeting these products.
Example Test 2 - Basket Hold Timer Removal
I mentioned at the start that MOD had installed a number of apps on the website in order to try to improve conversion rates or average order values.
One of those apps was a basket hold timer, it said Your basket will be held for 15:00.
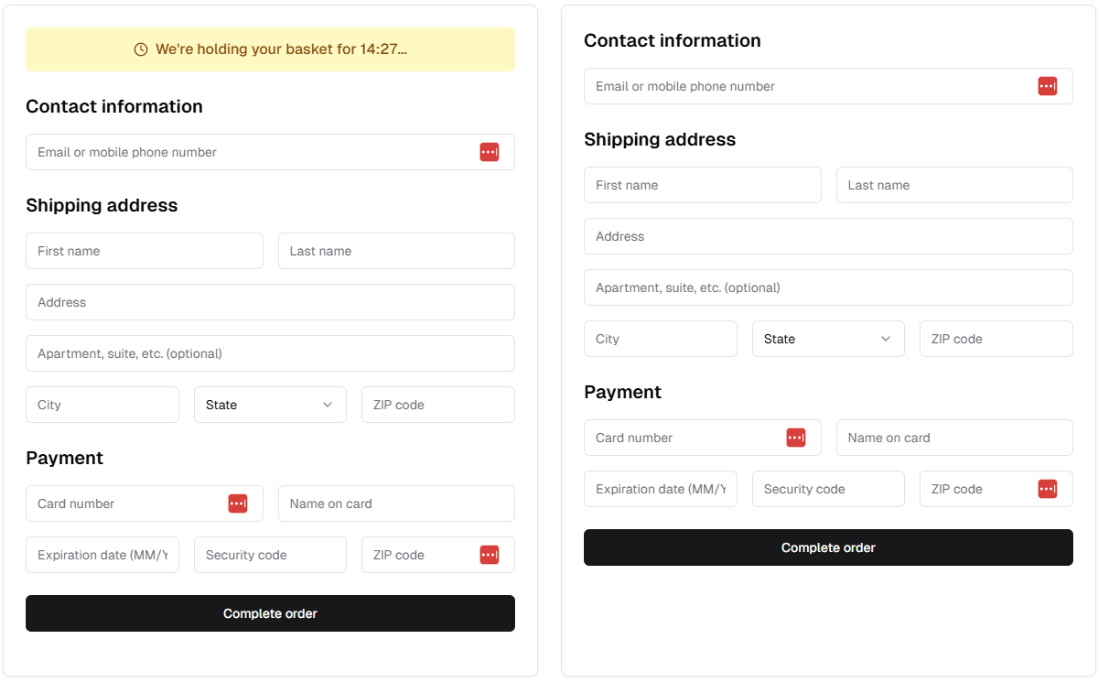
It’s quite common to see timers on ecommerce websites, although normally countdowns for how long until next day shipping is unavailable. These work really well in our experience.
However in this case, this type of timer works well when products are actually limited. Think event or plane tickets, limited edition release, or hotel bookings.
When customers are spending months researching the ideal lights for their home, they’re not going to respond well to a timer telling them they only have 15 minutes to complete the purchase.
Just because you see something used on another site, doesn't mean it’ll work for you. For all you know, its not even working for them either.
Great brands tackle them with CRO.
can unlock your next stage of growth.